
Stock Reports
Learn how to view stock movements, check inventory levels, identify ageing and expiring medicines, and generate customized stock reports in MediFlux.
Stock Reports
The Stock Reports section in MediFlux helps you track inventory movements, review available stock, identify medicines that need attention, and understand the value of your inventory.
Whether you want to check today's stock movements, find medicines nearing expiry, identify products that are not selling, or calculate the value of your stock, you can generate the relevant report from one place.
MediFlux provides ready-to-use reports for common requirements, along with manual reports that let you customize how the information is grouped and displayed.
For inventory searching and filtering, see Drug List. To review stock across warehouses, see Warehouse.
Accessing Stock Reports
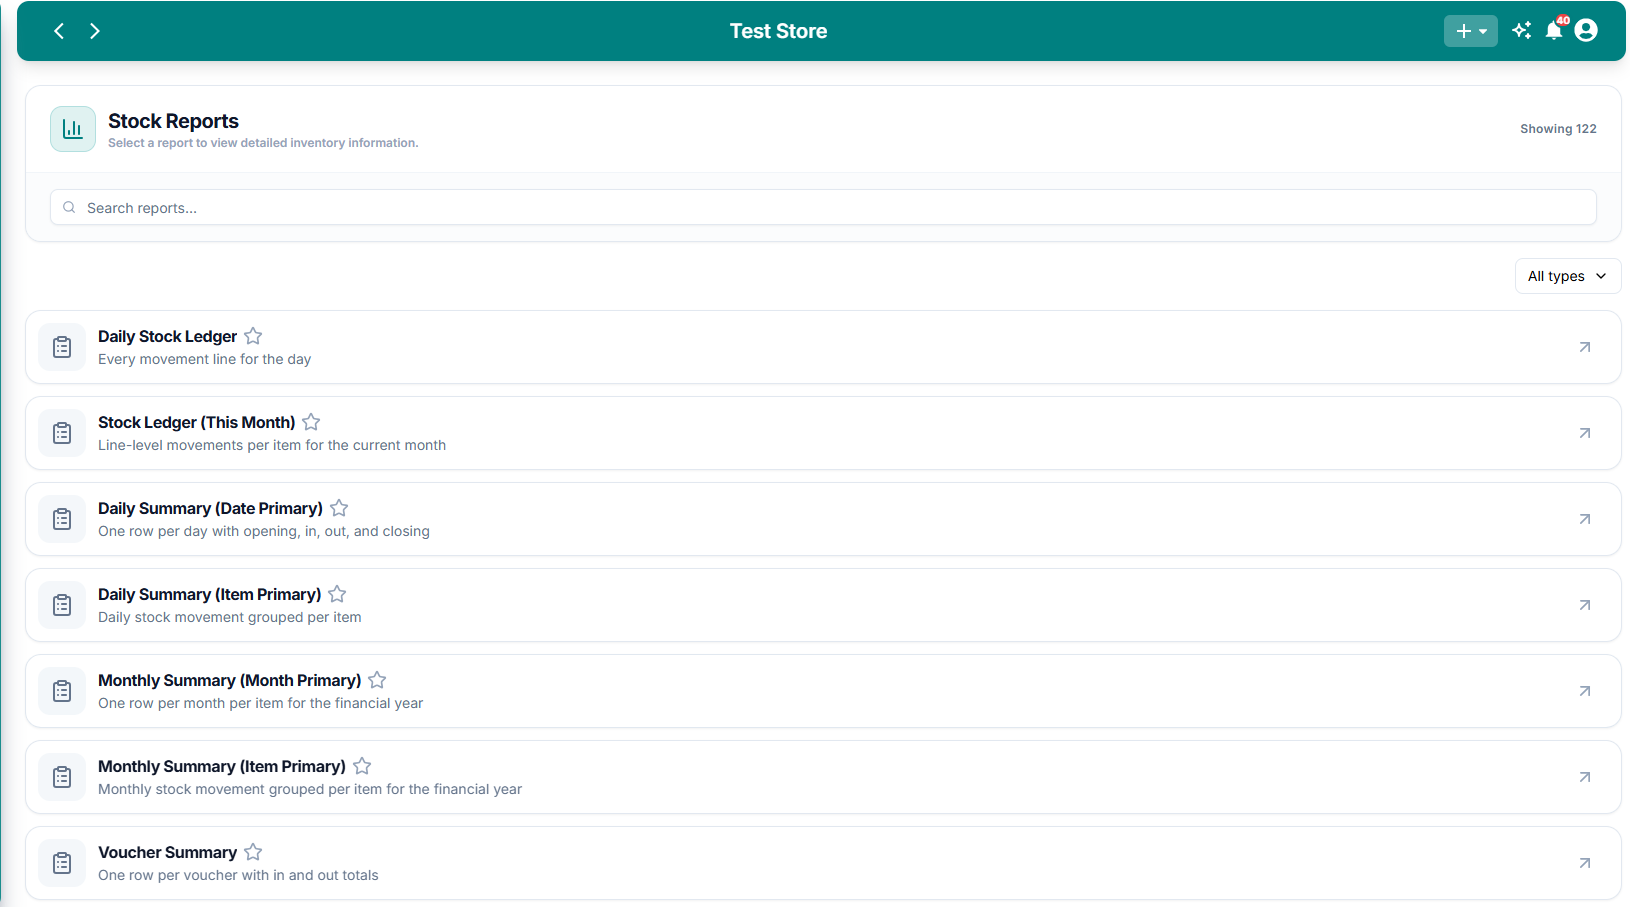
Stock Reports
The Stock Reports page displays available report templates, a search bar, and a report type dropdown.
By default, the page displays reports from All types.
Finding a Report
With multiple reports available, you can use the search bar and report type dropdown to find the information you need.
Search Reports
Use the Search reports... field to search for a report by its name.
For example, enter Daily Stock Ledger, Near Expiry, or Stock Valuation to find matching reports.
Filter by Report Type
Click the All types dropdown at the top-right of the report list.
Select the category you want to explore.
The available report types are:
- Stock Ledger
- Stock Register
- Stock Summary
- Stock Ageing
- Near Expiry
- Dead Stock
- Fast Moving
- Stock Valuation
Selecting a category displays the reports belonging to that type. Choose All types to return to the complete list.
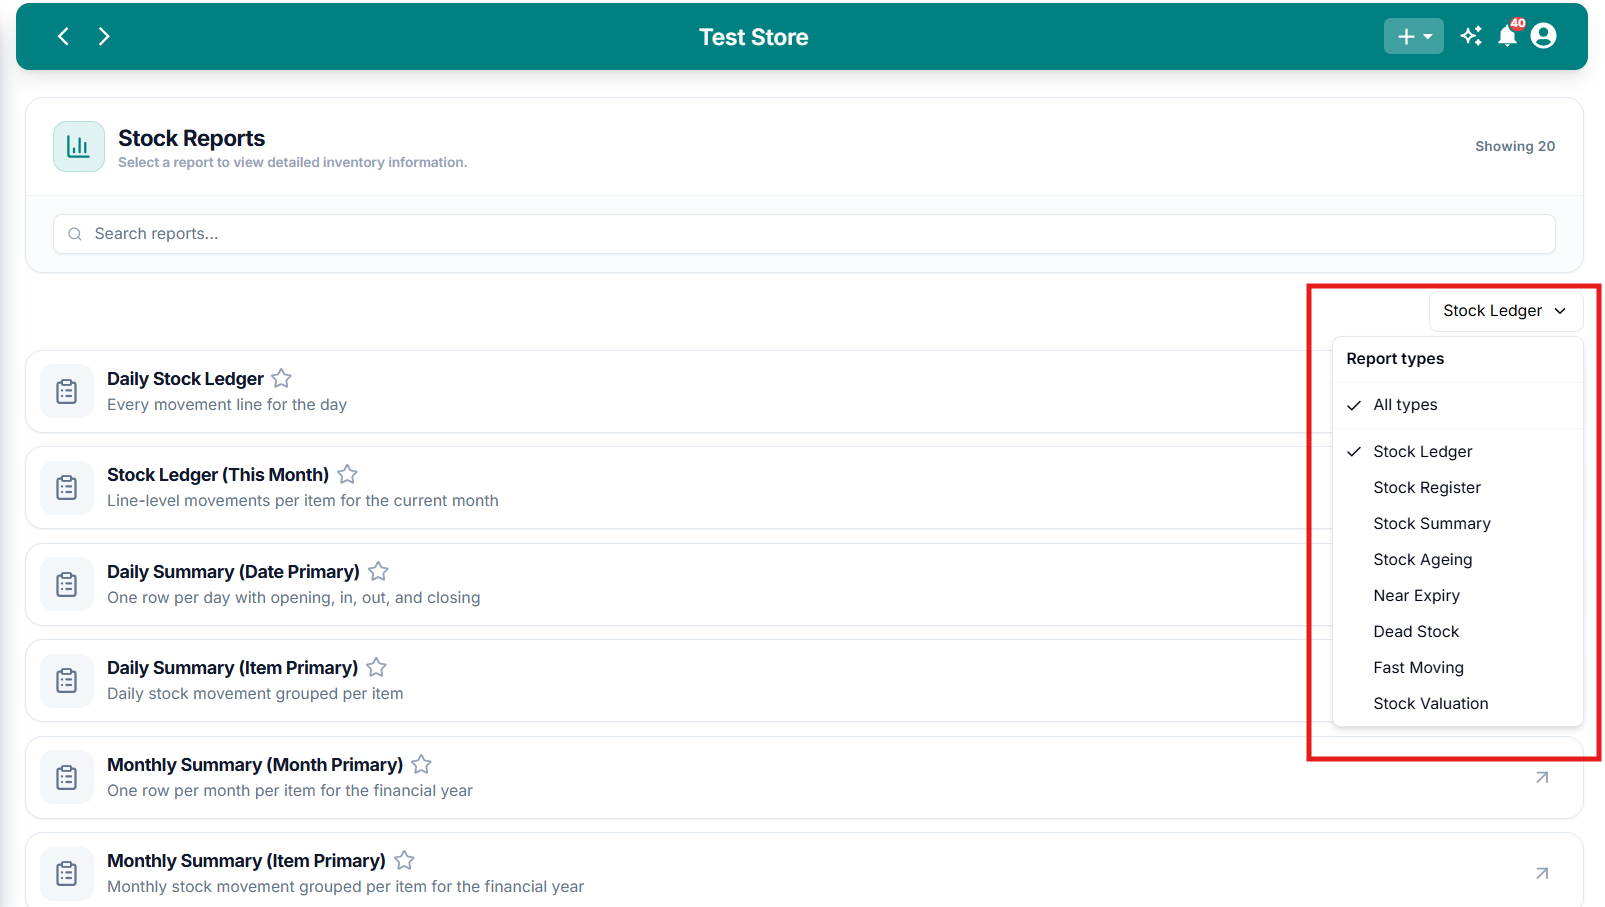
Filter Reports by Type
Use the report type dropdown to display reports from a particular stock report category.
Understanding Stock Report Types
Each report type serves a different purpose. Within a category, MediFlux provides several report templates for different periods, groupings, and analysis requirements.
Stock Ledger
Stock Ledger reports show how inventory moves into and out of your store.
They help you trace stock movements through purchases, sales, returns, and other stock transactions.
Common reports include:
- Daily Stock Ledger: View individual stock movements for the day.
- Stock Ledger (This Month): Review item-level movements for the current month.
- Purchase Ledger: Review stock received through purchase vouchers.
- Sales Ledger: Review stock issued through sales.
- Returns Ledger: Track purchase and sales returns.
- Batch-wise Ledger: Review stock movements for individual batches.
You can also find reports grouped by warehouse, company, and medicine schedule.
When to use: Select Stock Ledger when you need to understand when, how, or through which transaction stock moved.
Stock Register
Stock Register reports summarize stock movement over a selected period, including opening quantities, inward stock, outward stock, and closing quantities.
Available templates include:
- Stock Register (This Month)
- Stock Register (Batch wise)
- Stock Register (Company wise)
- Stock Register (Category wise)
- Stock Register (Warehouse wise)
- Stock Register (HSN wise)
You can also find reports for items with movement, items without movement, and stock quantities and values.
When to use: Select Stock Register when you want to reconcile opening stock, inward movement, outward movement, and closing stock.
Stock Summary
Stock Summary reports provide an overview of available inventory.
You can review stock by medicine, batch, company, supplier, category, rack, warehouse, HSN code, and other groupings.
Examples include:
- Stock Summary (Item wise): Current stock for each medicine.
- Stock Summary (Batch wise): Stock details by batch, including MRP and expiry.
- Out of Stock Items: Medicines with zero stock.
- Negative Stock Items: Medicines with negative stock quantities.
- Low Stock Items: Medicines with stock greater than zero but at or below their reorder level.
- High-Value Stock: Available stock arranged by value.
When to use: Select Stock Summary to check stock availability, identify shortages, and review current inventory.
Stock Ageing
Stock Ageing reports help you identify inventory that has remained in stock for longer periods.
They provide ageing information by item, batch, company, supplier, or warehouse.
Examples include:
- Stock Ageing (Item wise)
- Ageing Bucket Matrix (Item wise)
- Stock older than 90 days
- Stock older than 180 days
- Stock Ageing (Batch wise)
- Ageing vs Last Month-end
Ageing Bucket Matrix reports organize stock into age ranges such as 0–30, 31–60, 61–90, 91–180, and 180+ days.
When to use: Select Stock Ageing to identify older inventory and review stock that may require attention.
Near Expiry
Near Expiry reports help you identify medicines that have expired or are approaching their expiry dates.
Examples include:
- Near Expiry (Action List): Expired stock and batches expiring within six months.
- Expired Stock: Stock that has already expired.
- Expiring in 1 Month
- Expiring in 3 Months
- Returnable to Supplier: Stock expiring within three to six months, grouped by supplier.
- Expiry Bucket Summary: Stock organized into expiry periods.
When to use: Select Near Expiry to plan stock returns, review expiry risks, and prioritize medicines that require action.
The Returnable to Supplier report helps identify potentially returnable stock. Whether a supplier accepts a return depends on the supplier's return policy.
Dead Stock
Dead Stock reports identify medicines that have not recorded sales during a particular period.
Available reports include:
- Dead Stock (30 days)
- Dead Stock (60 days)
- Dead Stock (90 days)
- Dead Stock (180 days)
- Never Sold: Purchased items that have never been sold.
- Gone Cold: Items that sold previously but have had no recent sales.
- Staleness Summary: Dead stock grouped by the time since its last sale.
You can also review dead stock by batch, supplier, company, or category.
When to use: Select Dead Stock to identify slow-selling inventory and make better purchasing and stock management decisions.
Fast Moving
Fast Moving reports help you identify medicines with high sales activity.
Examples include:
- Fast Moving (30 days)
- Fast Moving (60 days)
- Fast Moving (90 days)
- Fast Moving (180 days)
- Class A, B, and C Items
- ABC Summary
- Stockout Risk: Fast-moving medicines with fewer estimated days of stock remaining.
Reports are also available by company and supplier.
When to use: Select Fast Moving to understand product demand, identify frequently sold medicines, and support replenishment planning.
Stock Valuation
Stock Valuation reports help you understand the monetary value of your available inventory.
You can review stock value using different pricing bases, such as cost, MRP, or trade price.
Examples include:
- Stock Valuation at Cost
- Stock Valuation at Cost (Company wise)
- Stock Valuation at MRP (Category wise)
- Stock Valuation (Batch wise)
- Potential Sales Value (at MRP)
- Margin Ranking (vs MRP)
- Valuation vs Last Month-end
- Stock Valuation (Manual)
When to use: Select Stock Valuation to estimate inventory value, compare stock values, and review potential sales value.
Stock valuation and potential sales value are different. A report calculated using MRP represents the value of stock at the listed maximum retail prices, not actual sales revenue.
Generating a Predefined Report
Predefined reports come with settings for a particular purpose, such as today's stock ledger or medicines that have not sold in the last 90 days.
You can open these reports directly without manually selecting every parameter.
For example, to view the Daily Stock Ledger:
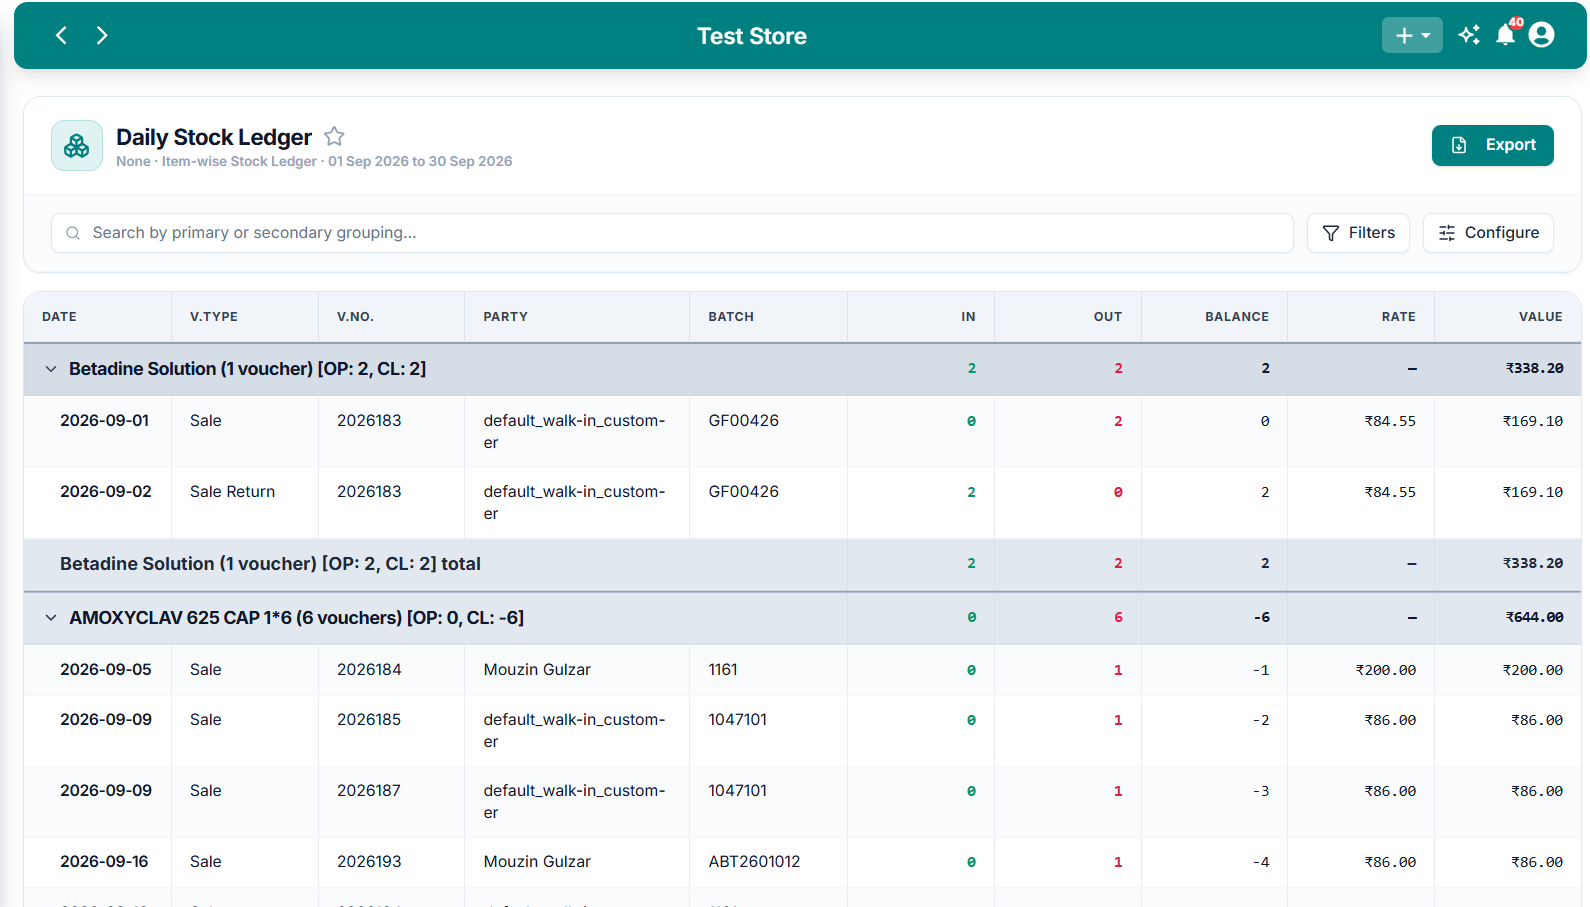
Daily Stock Ledger
The Daily Stock Ledger displays stock movements grouped by medicine, with inward and outward quantities, balances, rates, and values.
Understanding the Daily Stock Ledger
The report contains columns such as:
Medicine names appear as grouped rows.
Click the arrow beside a medicine to expand or collapse its transaction details.
The report also displays totals for the grouped records and a Grand Total at the bottom.
A negative balance indicates that the calculated stock balance is below zero. Review the relevant transactions if the quantity does not match your physical stock.
Generating a Manual Report
Manual reports allow you to select report settings before generating the results.
Each stock report category includes a manual option, such as Stock Ledger (Manual), Stock Register (Manual), or Stock Valuation (Manual).
For example, to generate a customized Stock Valuation report:
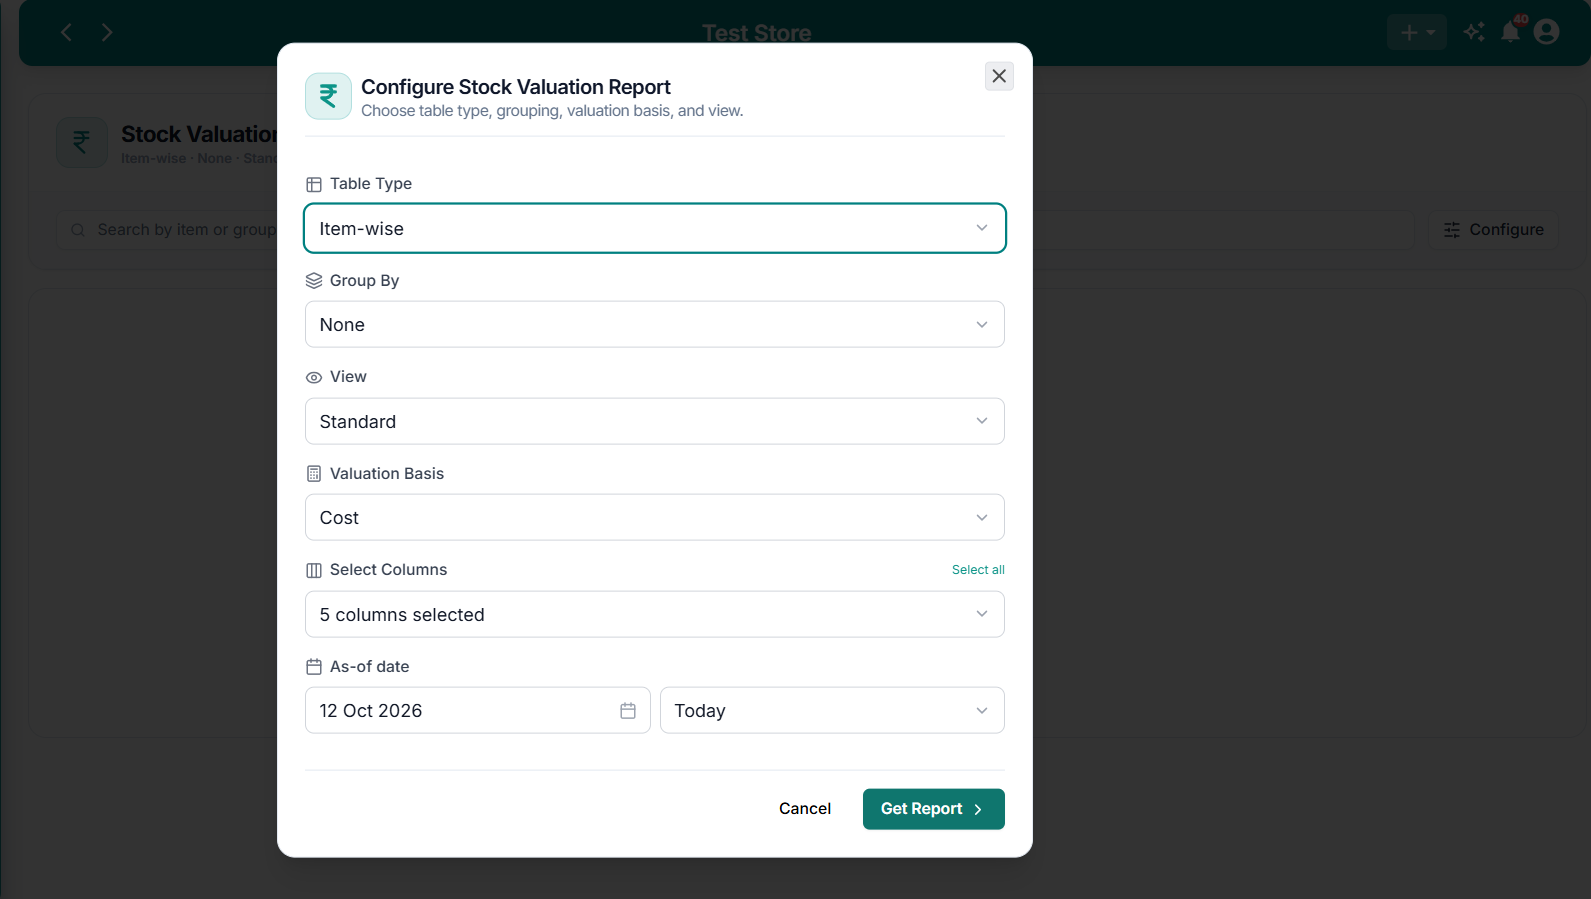
Configure Stock Valuation Report
The manual Stock Valuation report allows you to select table type, grouping, view, valuation basis, columns, and an as-of date.
For Stock Valuation, the configuration shown includes:
The configuration workflow is available across stock report types. The settings displayed reflect the report being generated.
Configuring an Open Report
You can also change report settings after opening a predefined report.
Click Configure above the report table to open its configuration dialog.
For example, the Stock Ledger configuration includes:
- Primary Group: Choose the main grouping for the report.
- Secondary Group: Choose how records are grouped within the primary group.
- Analysis Dimension: Select the inventory records to include.
- Detail Level: Choose the level of detail displayed.
- Select Columns: Select the columns to include in the report.
- Date Period: Choose the reporting period.
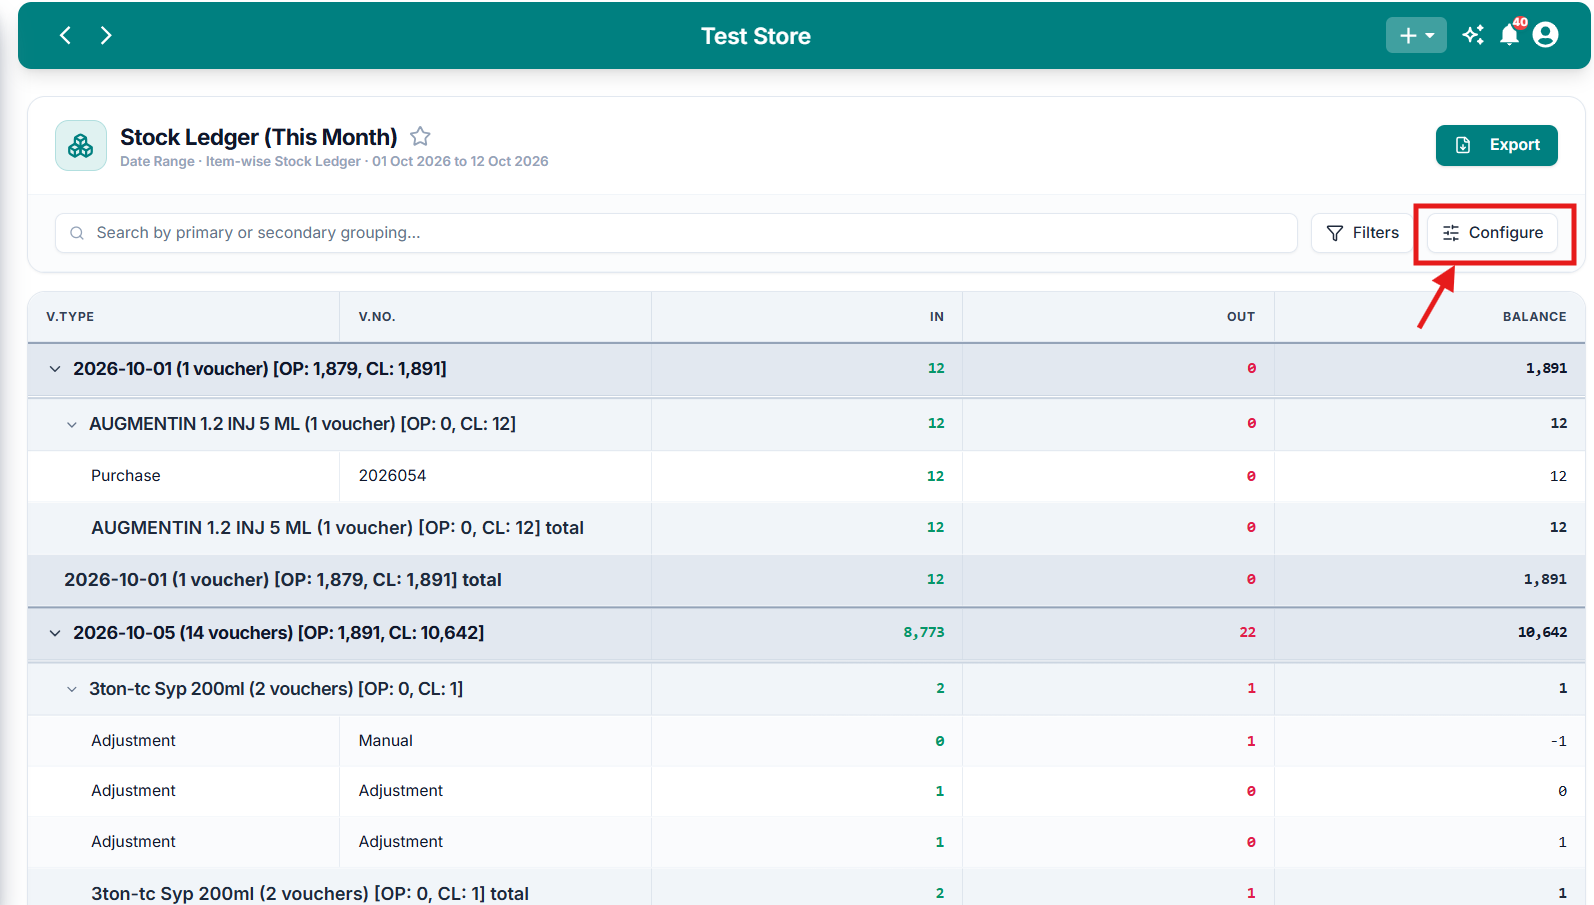
Configure Stock Ledger Report
The Configure dialog provides grouping, analysis, detail, column selection, and date period settings.
After making your changes, click Get Report.
MediFlux generates the report according to the selected settings.
This allows you to start with a predefined report and adjust it when you need a different grouping, period, or level of detail.
Filtering Report Results
Once a report is open, you can narrow the displayed information using Filters.
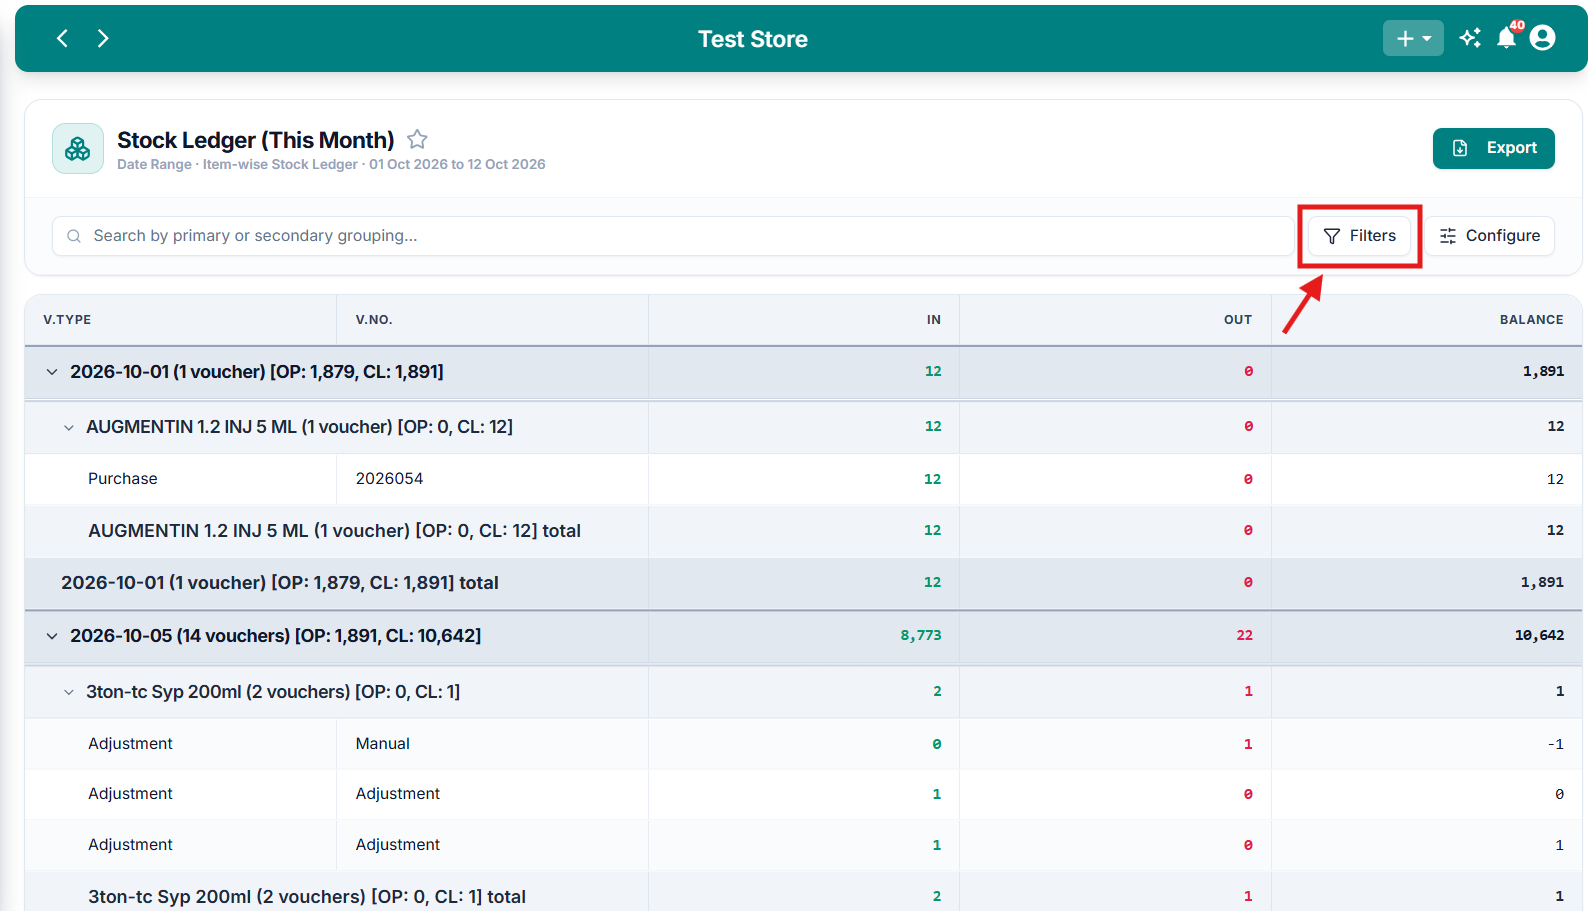
Stock Report Filters
The Filters panel allows users to narrow report results using customer, supplier, voucher, medicine, batch, warehouse, and manufacturer selections.
The Stock Ledger filter panel includes:
The available filtering options may depend on the report and its data.
Searching Within a Report
Generated reports also provide a search field above the results table.
For example, the Stock Ledger displays Search by primary or secondary grouping....
Use this field to locate matching groups within the report instead of scrolling through every record.
The search applies to the generated report, while the search field on the main Stock Reports page is used to find report templates.
Exporting a Report
You can export a generated report for further review or recordkeeping.
Review the selected date period, grouping, and filters before exporting so that the report contains the information you intended to include.
Choosing the Right Report
If you are unsure which report to use, start with the question you want to answer.
Important Notes
- All types displays report templates from every stock report category.
- Selecting a report type filters the template list. It does not generate a report by itself.
- Predefined reports use settings appropriate to their stated purpose.
- Manual reports allow you to select report parameters before generating results.
- Use Configure to adjust report settings and Filters to narrow report results.
- The information displayed in a report depends on the selected period, grouping, filters, and recorded stock transactions.
- Always review the report settings before using the results for inventory reconciliation or business decisions.